Category | CLOUD and AWS
Last Updated On 27/02/2026

When working with AWS monitoring and governance services, CloudTrail vs CloudWatch is one of the most common points of confusion for beginners and even experienced professionals. At first glance, both services seem to deal with “monitoring,” but in reality, they serve very different purposes inside an AWS environment.
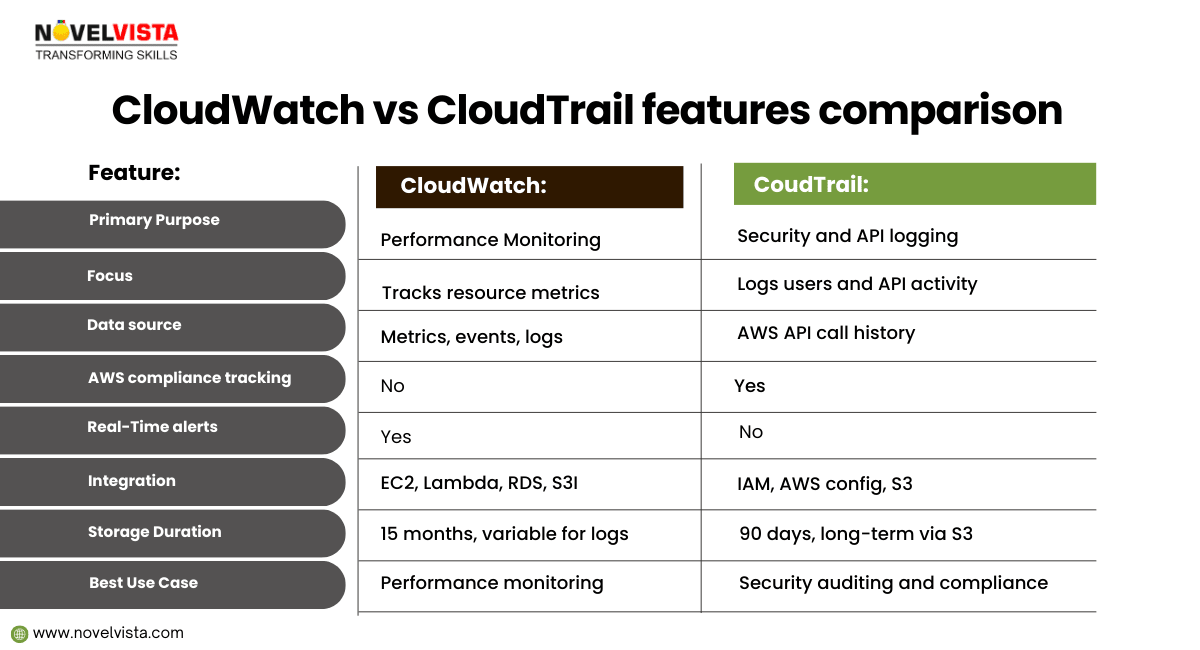
Amazon CloudWatch focuses on performance and operational health. It helps teams track metrics, logs, and system behavior in real time. AWS CloudTrail, on the other hand, is designed for visibility and accountability. It records user actions and API activity, making it critical for security audits, compliance, and forensic investigations.
Understanding the difference between AWS CloudWatch and CloudTrail is essential for building secure, reliable, and compliant cloud architectures. In this blog, we’ll break down what each service does, their key features and use cases, and clearly explain the difference between CloudTrail and CloudWatch, so you know exactly when—and why—to use each one.
Amazon CloudWatch is a monitoring and observability service built for DevOps engineers, developers, site reliability engineers (SREs), and IT managers. CloudWatch provides you with data and actionable insights to monitor your applications, respond to system-wide performance changes, optimize resource utilization, and get a unified view of operational health. CloudWatch collects monitoring and operational data in the form of logs, metrics, and events, providing you with a unified view of AWS resources, applications, and services that run on AWS and on-premises servers. You can use CloudWatch to detect anomalous behavior in your environments, set alarms, visualize logs and metrics side by side, take automated actions, troubleshoot issues, and discover insights to keep your applications running smoothly.
Amazon CloudWatch is an advanced AWS service that provides real-time performance data for applications, AWS services, and frameworks.
Imagine and retailer running its website on Amazon EC2. Sudden traffic boost can cause issues during performance. with CloudWatch, the retailer can:
By integrating CloudWatch with other AWS logging services, the retailer ensures optimal application performance
CloudWatch collects monitoring and operational data in the form of logs, metrics, and events, and visualizes it using automated dashboards so you can get a unified view of your AWS resources, applications, and services that run in AWS and on-premises. You can correlate your metrics and logs to better understand the health and performance of your resources. You can also create alarms based on metric value thresholds you specify, or that can watch for anomalous metric behavior based on machine learning algorithms. To take action quickly, you can set up automated actions to notify you if an alarm is triggered and automatically start auto scaling, for example, to help reduce mean-time-to-resolution. You can also dive deep and analyze your metrics, logs, and traces, to better understand how to improve application performance.

Monitor key metrics and logs, visualize your application and infrastructure stack, create alarms, and correlate metrics and logs to understand and resolve the root cause of performance issues in your AWS resources. This includes monitoring your container ecosystem across Amazon ECS, AWS Fargate, Amazon EKS, and Kubernetes.
CloudWatch helps you correlate, visualize, and analyze metrics and logs, so you can act quickly to resolve issues, and combine them with trace data from AWS X-Ray for end-to-end observability. You can also analyze user requests to help speed up troubleshooting and debugging, and reduce overall mean-time-to-resolution (MTTR).
CloudWatch alarms watch your metric values against thresholds that either you specify, or that CloudWatch creates for you using machine learning models to detect anomalous behavior. If an alarm is triggered, CloudWatch can take action automatically to enable Amazon EC2 Auto Scaling or stop an instance, for example, so you can automate capacity and resource planning.
Monitor your applications that run on AWS (on Amazon EC2, containers, and serverless) or on-premises. CloudWatch collects data at every layer of the performance stack, including metrics and logs on automatic dashboards.
Explore, analyze, and visualize your logs to address operational issues and improve application performance. You can perform queries to help you quickly and effectively respond to operational issues. If an issue occurs, you can start querying immediately using a purpose-built query language to rapidly identify potential causes.
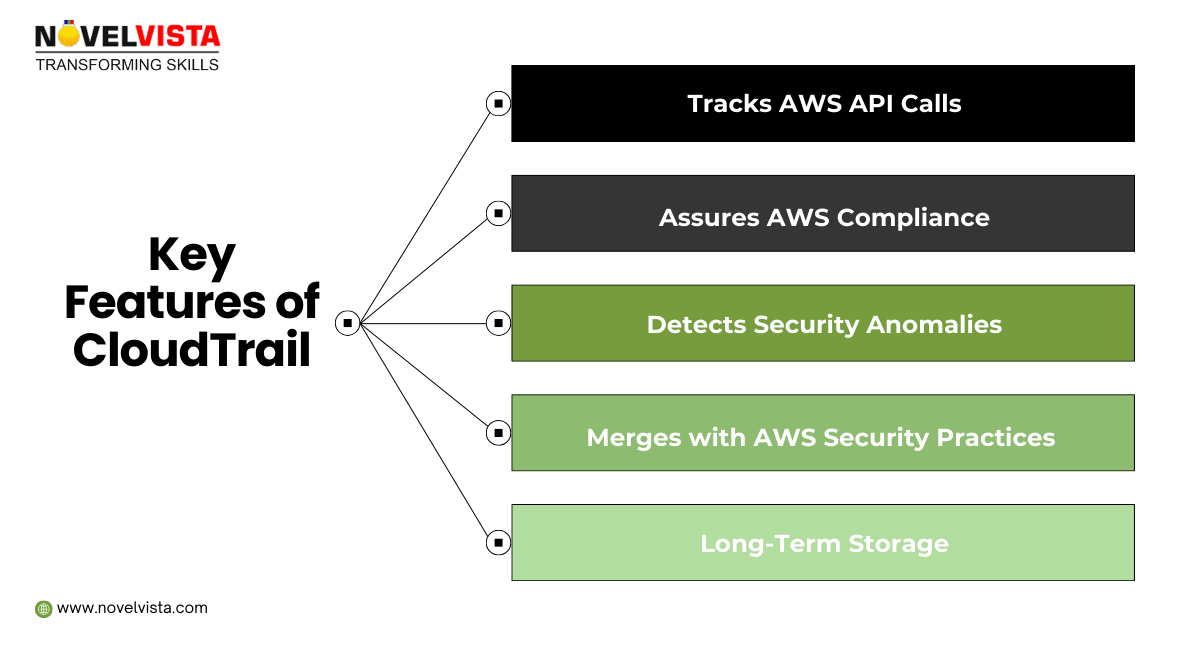
AWS CloudTrail is a service that enables governance, compliance, operational auditing, and risk auditing of your AWS account. With CloudTrail, you can log, continuously monitor, and retain account activity related to actions across your AWS infrastructure. CloudTrail provides event history of your AWS account activity, including actions taken through the AWS Management Console, AWS SDKs, command-line tools, and other AWS services. This event history simplifies security analysis, resource change tracking, and troubleshooting. Also, you can use CloudTrail to detect unusual activity in your AWS accounts. These capabilities help simplify operational analysis and troubleshooting.
AWS CloudTrail is a logging and security auditing service that tracks all API activity within an AWS account. It provides visibility into who performed what action, when, and from where.

A financial company notices an unusual IAM user login from an unknown IP address. Using CloudTrail, the security team:
AWS CloudTrail makes it easier to ensure compliance with internal policies and regulatory standards by providing a history of activity in your AWS account. For more information, download the AWS compliance whitepaper, “Security at Scale: Logging in AWS.”
You can perform security analysis and detect user behavior patterns by ingesting AWS CloudTrail events into your log management and analytics solutions.
You can detect data exfiltration by collecting activity data on S3 objects through object-level API events recorded in CloudTrail. After the activity data is collected, you can use other AWS services, such as Amazon CloudWatch Events and AWS Lambda, to trigger response procedures.
You can troubleshoot operational issues by leveraging the AWS API call history produced by AWS CloudTrail. For example, you can quickly identify the most recent changes made to resources in your environment, including the creation, modification, and deletion of AWS resources (e.g., Amazon EC2 instances, Amazon VPC security groups, and Amazon EBS volumes).
You can detect unusual activity in your AWS accounts by enabling CloudTrail Insights. For example, you can quickly alert and act on operational issues such as erroneous spikes in resource provisioning or services hitting rate limits.
CloudTrail captures actions made directly by the user or on behalf of the user by an AWS service. For example, an AWS CloudFormation CreateStack call can result in additional API calls to Amazon EC2, Amazon RDS, Amazon EBS, or other services as required by the AWS CloudFormation template.


Though different, CloudWatch vs CloudTrail works best when integrated.
This proactive approach enhances AWS security and AWS operational monitoring in real-time.
With continuously evolving AWS, it's important to stay updated with whats new in AWS relating CloudWatch and CloudTrail.
By following these AWS Security Practices, organizations improve security, compliance, and system reliability.
Understanding CloudTrail vs CloudWatch is essential if you want a secure, well-monitored AWS environment. CloudWatch focuses on performance, availability, and operational health, helping teams detect issues early and keep applications running smoothly. CloudTrail, on the other hand, provides accountability and security visibility by recording every action taken in your AWS account.
The real strength lies in using them together. CloudWatch tells you how your systems are performing, while CloudTrail shows who did what and when. Combined, they support compliance, faster incident response, and confident cloud governance. For anyone serious about AWS, developers, architects, or security professionals, mastering both services is no longer optional. It’s a foundational skill for building reliable, compliant, and scalable cloud solutions.
If you want to move beyond theory and truly master AWS monitoring, security, and architecture, structured learning makes the difference. NovelVista’s AWS Solution Architect Associate Professional Certification is designed to help you apply services like CloudWatch and CloudTrail in real-world scenarios.
Led by AWS experts, the program covers core architecture principles, hands-on labs, and exam-focused strategies aligned with Amazon Web Services best practices. It’s an ideal next step to strengthen your cloud skills and accelerate your AWS career with confidence.
Author Details
Confused About Certification?
Get Free Consultation Call
Stay ahead of the curve by tapping into the latest emerging trends and transforming your subscription into a powerful resource. Maximize every feature, unlock exclusive benefits, and ensure you're always one step ahead in your journey to success.